

#50: China Reopen: This Time, For Real
01/22/2023

To stay in touch, you can find us here: Gabrielle's Twitter and Shan’s Twitter
China Reopen: This Time, For Real
Happy Lunar New Year!
Though we briefly touched on China Reopen during the Dec issue (Compounders #46), it was really not until Jan 8th that China fully abandoned the quarantine policy and opened up the border. The first group of travelers covered by the new regulations included 387 passengers from Singapore and Toronto. No one had to undergo COVID-19 test after arrival or the former five-day quarantine. Recovery is set in place, and a new paradigm awaits. So what should we expect for the next few months and China Reopen’s potential implications? Let’s dive into our read here:
I - Inbound Travel Surge, but Constrained by Capacity
Google Search interest for “Flight to China” is back to the 2019 level. The pent-up demand of overseas Chinese going back to visit family members will cause a pretty significant inbound travel movement in the next few months. However, Demand >>> Supply and Supply are still relatively static. Flights into the country still need regulatory approval. At a time of U.S.- China trade tensions, short-term capacity could remain limited. United Airlines, which had 584 flights to and from China in Jan 2019, according to Cirium, can now only fly 4 times weekly from the U.S. to mainland China. The reverse is also true - Air China, Hainan Airlines, and China Southern Airlines have filed schedules with the U.S. Department of Transportation to increase flights as much as daily. Demand > Supply = Increased Price.
A round trip from SFO to Shanghai on United in early March now costs $3,852 in economy and $18,369 in business. We expect this price “insanity” to continue in the short term.

(source: Google Trends)
II - Outbound Tourism to Benefit Southeast Asia and European Leisure Industries
Before COVID, China was the world’s most important source of international tourism. 155 million tourists spent more than a quarter of a trillion dollars abroad in 2019. With China’s reopening, millions of tourists are poised to return to the world stage.. In 2019, Mainland Chinese tourists made up 34% of South Korea’s tourist visits, 36% of Cambodia’s, 30% of Japan’s, and 28% of Thailand’s. Coming out of 3-year of country-wide lockdown, Chinese citizens are on a “revenge travel” spree. Bookings for oversea travel during Lunar NY surged by 5 folds YoY, with spending up by 32%, according to CNN news. Top destinations are Australia, Thailand, Japan, and Hong Kong. UK and France are also the top countries considered. We expect Southeast Asia, European, Japan/Korea leisure industries to benefit the most from this resurgence.

(source: The Economists)
III - Inflation Worries and Potential Worldwide Impact
China’s reopening, like most other countries’ reopening, will come with economic growth acceleration but also a pick-up in inflation. Pent-up demand and spending from the world’s second-largest economy will send a rippling effect around the world. According to economists at Nomura, Chinese households have built up $720 billion worth of excess savings. The impact will be two folds - on the one side, supply chain constrained-led manufacturing and commodity inflation will be tamed. Despite a noticeable amount of manufacturing capacity transfers out of China into SEA, China remains the heart and center of global commodities and goods. Reopening could even help with the magnitude of U.S. inflation. On the other side, energy and general consumption will be the offsetting effect with short-term spikes.

IV - So, Let’s Long ADRs? No So Fast.
One sentence takeaway is that: if you just wake up to China Reopen’s potential impacts, you may be too late to the party. GOAT trade is to LONG Tencent in Oct, 2022 - the stock rebounded a shocking 87% during the past 3 months. MSCI China Index’s performance would be just shy of that - index bounced back ~50% during the same period. Now that China's Reopening is the “new normal”, further upside in ADRs would need to come from underestimated upside surprises. However, if constraints on travel dealy the tourism-impacted economy recovery further, these short-term inflections in stock prices could even be proven too optimistic.

Chart of the Week in the Public Market:
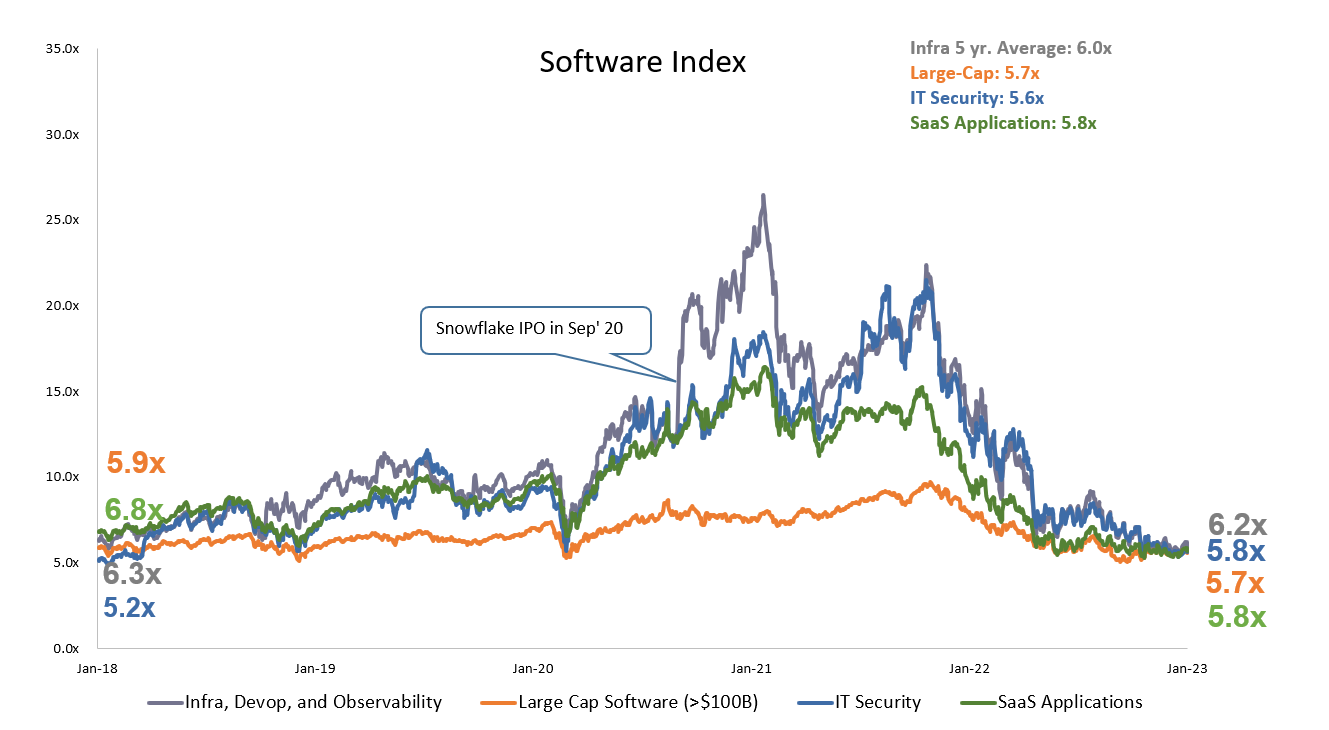
Nasdaq continues to trend higher, driven by the soft landing narrative and the NFLX’s strong performance.

Fintech index continued its moderation from 8.9x to 8.5x and now sits at 8.3x, a pretty significant discount to the 3-yr median.

Optimism in the Consumer sector continued, with the index climbing up from 2.7x to 2.9x.

(Market data as of 1/20/2022, source: Bloomberg, CapIQ. See index composition at the bottom)
Chart of the Week in Private Market

(Deal data as of 1/22/2022, source: Pitchbook. Defined as - Series B+ global growth stage deals)
Here we are - last week’s trailing 1-month Global Growth Dollar Deployed figure ended at $5.7B, the second lowest number on Compounders’ record since we started tracking in November 2021. Among the announced deals, regions outside of North America took up a decent chunk. While primary announcements haven’t been as active, we think the market is now brewing with many secondaries opportunities from liquidity demand. The longer we wait for the IPO window to reopen, the more likely we will see discounted secondaries to float in the market.
Sources: Software Index: over 200+ public companies / Fintech Index: V, MA, PYPL, SQ, BILL, ADYEN, SHOP, LSPD / Consumer Index: ABNB, BMBL, CHWY, CVNA, DASH, DHER, DKNG, DUOL, ETSY, FB, FTCH, GDRX, GOOGL, MTCH, NFLX, OPEN, PINS, POSH, PTON, ROKU, SFIX, SNAP, SPOT, UBER, W. Please feel free to ping us for further detailed breakdown