

#52: BILL Earnings: Are We out of the Woods?
02/05/2023

BILL Earnings - SMB Payment Volume Decline: Are We Out of the Woods Yet?
All You Need to Know: Bill stock was hit hard after earnings, with stock slumped by -26%. Companies’ revenue and profitability results all came out better than sell-side estimates. However, the accelerated Total Payment Volume decline (from 31% FYQ1-23 to 13% FYQ2-23) triggered broad-based concerned about SMB’s sensitivity around broader macrocycles. BILL mgmt. guided to a flat YoY volume growth in the next quarter, contemplating a dim outlook for the calendar first quarter 2023. The flat payment volume growth would also be the lowest in the company’s recent 5 years’ history. It will be interesting to see whether the 0% est. Payment volume indicates a near-term bottom. But for now, we are neither out of the woods nor in the clear yet.
Let’s Dive into the Numbers (note Bill has June YE)
Volume: The organic business reported $63.7B processed payment volume in the second quarter, up 13% on a year-over-year basis. The deceleration is clear here - going from 57% 3Q back -> 45% -> 31% -> 13%. The ~-20% delta also brought the YoY volume growth to a 3-year low point. Transaction Size (basket) led the majority of the slowdown from DD growth in the last few quarters to almost flat YoY.
Mgmt. called out a weaker macro environment leading to 2Q spending, which was indicative of the last 2-3 weeks of December and holiday season spending among SMBs & Mid-market players. Mid-market held up slightly better than SMBs, but the downward pressure from end customers is universal. The company guided towards a flat TPV growth YoY for Q3-23 driven by lower TPV per customer.

Take Rate & Margins: prior to this quarter, BILL has been expanding take rate at roughly ~0.6bps on a quarterly basis. The take rate expansion is driven by a mix of 1) Cash/Check - Electronics, 2) ad valorem product uptake, etc. However, this quarter’s take rate expansion moderated to 0.24bps driven by various factors, including FX headwind. However, total revenue at $260M still came on top of sell-side estimates with better profitability margin profiles.
The company reported solid NDR at 131% with 87% Gross margin among 400k business users - best-in-class metric for SMB serving software providers. Non-GAAP income at $0.42 per share was a solid increase YoY.
TAM, Industry Consolidation, and Cycle Resiliency: Bill.com is never a stock short of debates. At its core, Bill.com serves the U.S. and international SMB markets. By company estimates, the long-term TAM is about 30 Million SMBs & Sole proprietors and 70 Million global SMBs. However, this is not an easy market to serve - Brex just recently announced an exit from the SMB space. With price-sensitive business owners, subscription revenue may just serve as an entry point toward capturing more upside from transaction and float revenue.
SMBs are also the most sensitive to cycles and direct end consumers’ spending discretions. Compared to last week’s reported Azure’s Enterprise Cloud spending, the SMB spend volume here has seen faster rate of change. But we may also see stabilization here first if the economy trends toward a “soft landing”.
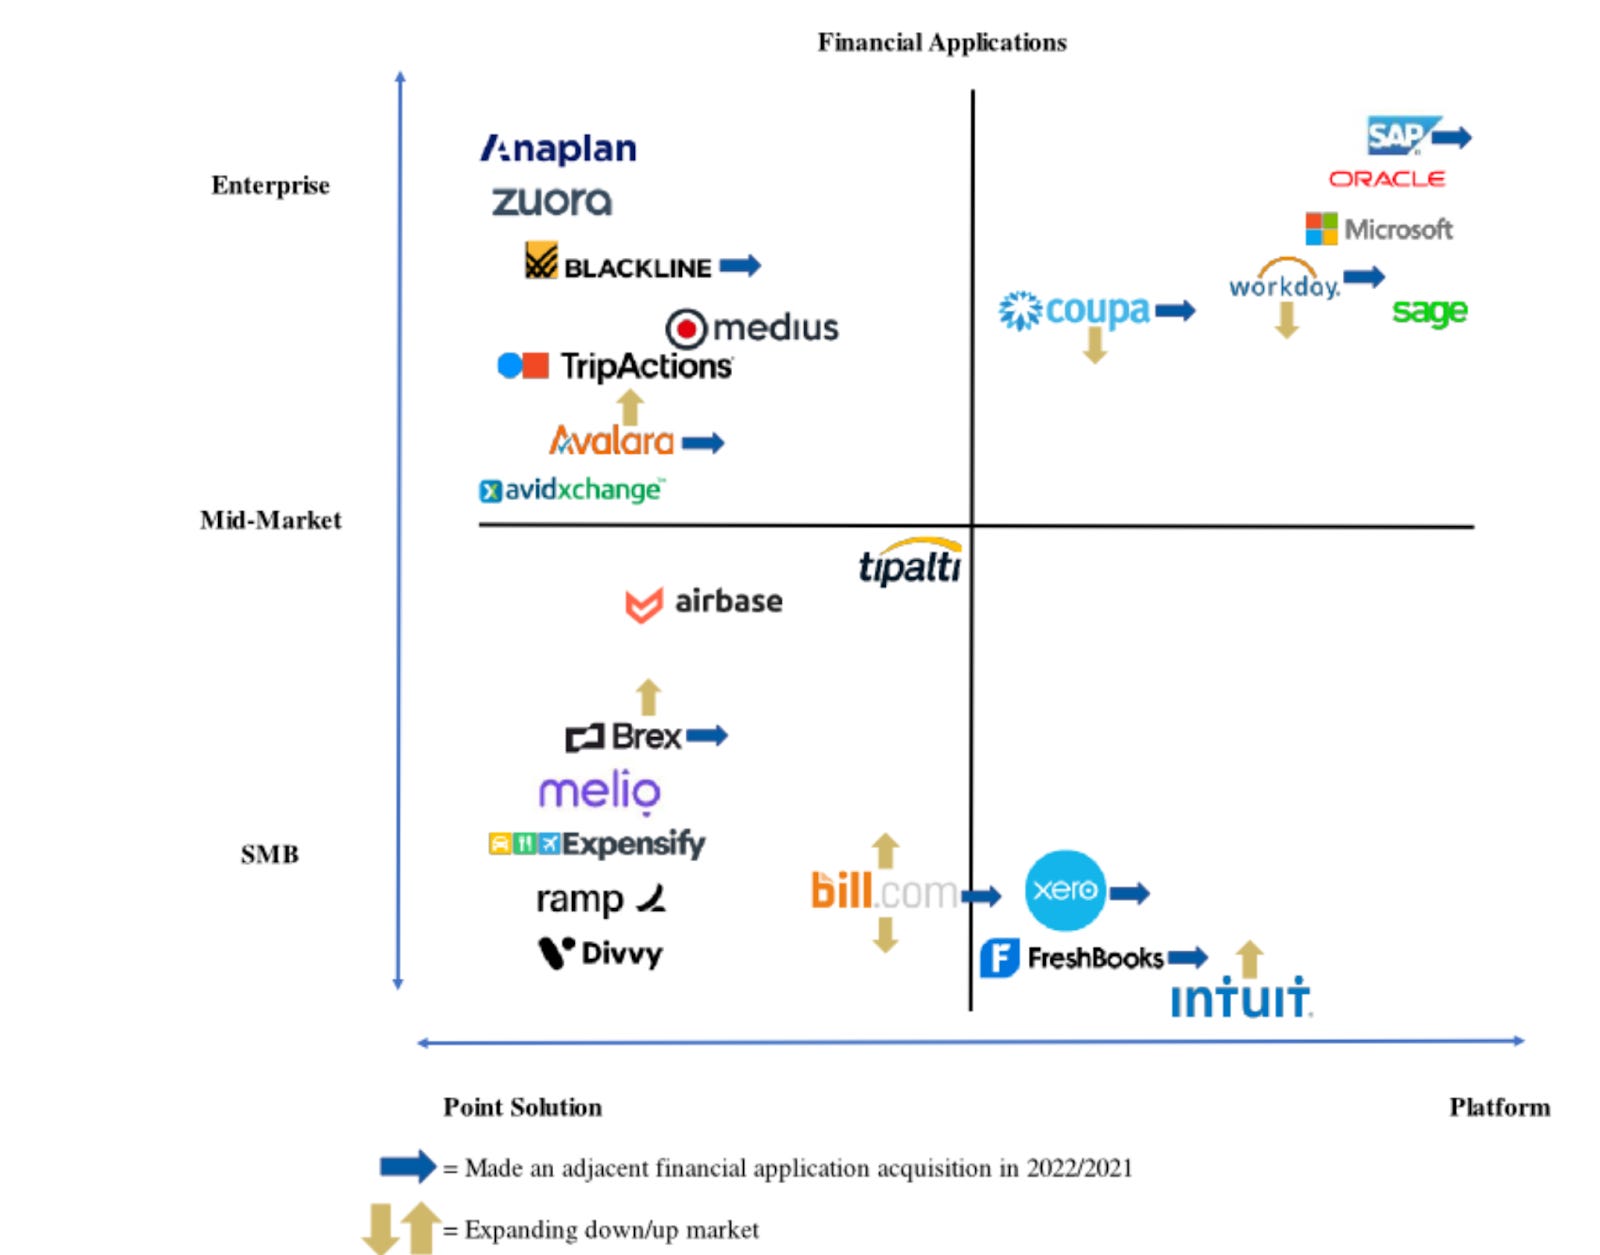
Chart of the Week in the Public Market:
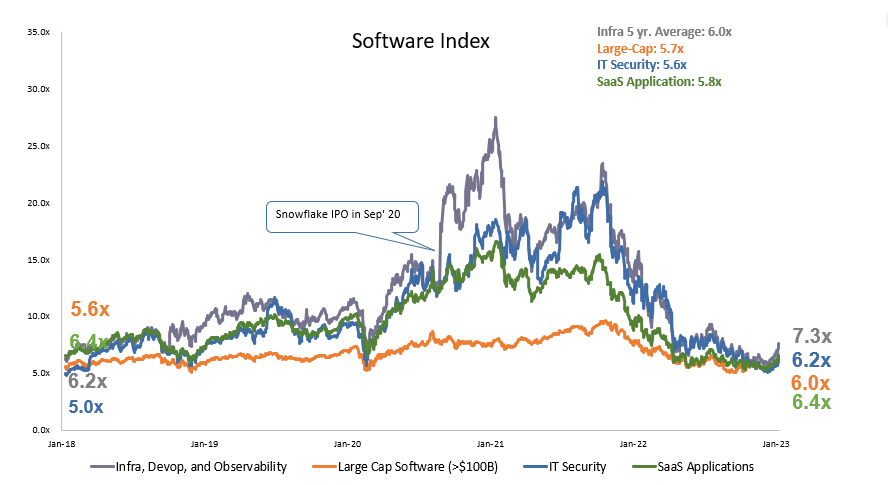
Bear market rally continued this week after FOMC meeting as market consensus anticipated a “soft landing” scenario: inflation falls back to 2% without triggering an economic recession or a rising unemployment rate.

The surge in Fintech index last week was proved unsustainable with quick revision down from 10.5x to 9.4x. A large part of that may be attributed to the BILL.com stock slide for -26%. B2B Payment gave back all the gains YTD and now back to ground zero. The financial impact on SMBs and Mid-market merchants, at least, hasn’t touched bottom.
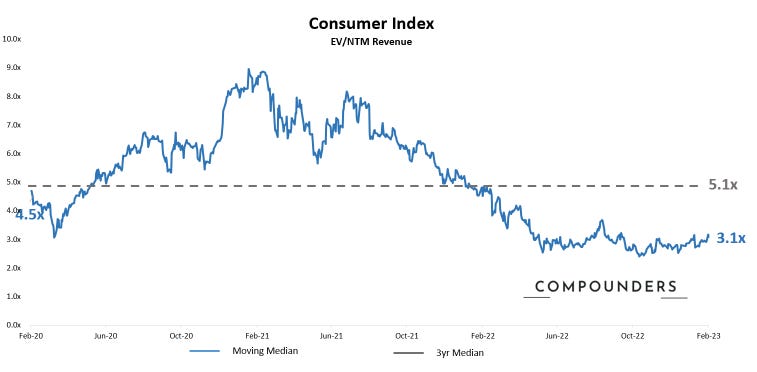
Consumer reportings came slightly later than big tech and enterprise, so we are just about 1-2 weeks away from those. The index remained roughly stable from last week’s 3x to 3.1x. Gaming continues to lead up the space with 4.2x.

(Market data as of 2/3/2023, source: Bloomberg, CapIQ. See index composition at the bottom)
Chart of the Week in Private Market

(Deal data as of 2/5/2022, source: Pitchbook. Defined as - Series B+ global growth stage deals)
Continued upward trajectory from two weeks prior’s low - trailing $7B of growth dollar deployed and announced. However, it’s hard to attribute this growth back to the North American market, as more than half of the deals announced last week were from Asia and Europe. Some of the larger North American deals announced include Leaflink, Moov, Treasury Prime, etc.
Sources: Software Index: over 200+ public companies / Fintech Index: V, MA, PYPL, SQ, BILL, ADYEN, SHOP, LSPD / Consumer Index: ABNB, BMBL, CHWY, CVNA, DASH, DHER, DKNG, DUOL, ETSY, FB, FTCH, GDRX, GOOGL, MTCH, NFLX, OPEN, PINS, POSH, PTON, ROKU, SFIX, SNAP, SPOT, UBER, W. Please feel free to ping us for further detailed breakdown