

#53: MSFT vs. GOOGL: Is it another AI hype or the iPhone moment in technology?
02.12.2023

To stay in touch, you can find us here: Gabrielle's Twitter and Shan’s Twitter

MSFT kicked off the AI race this week with a well-executed demo led by CEO Satya Nadella. Their message was clear: AI will reshape every software industry category, and MSFT is ready to go after the digital ad market with new Bing and Edge powered by chatGPT. 1% ad market share will lead to $2B in revenue from Google’s pocket. In response, Google pulled out a similar event to present its latest development on Bard, a chatGPT competitor product. However, the event was lackluster, and GOOGL’s share price dropped as much as 8% following an inaccurate answer by Bard. While we think it is too early to conclude that chatGPT is better than LaMDA, it is worthwhile to share our understanding of what is driving the market movement and assess the defensibility of Google’s market position.

(Chart source: Similar Web)
Price Movement: Why did Google share drop? Perceived share loss + disaster demo + margin pressure. Investors’ current focus is on market share redistribution. Given that Google has over 90% of the market share, it has to prove itself better than ChatGPT to defend its market share. MSFT, however, has nothing to lose. Any incremental gain is a win for MSFT. Brad’s product demo could only be described as a “disaster” - technical error, lack of preparation, and poorly orchestrated content that didn’t highlight much of Bard’s technical capability.
Additionally, incremental operating costs used to power AI will eat into profitability for as much as 600bps reduction in FY24 (see below for the math). So the risk/reward is skewed.
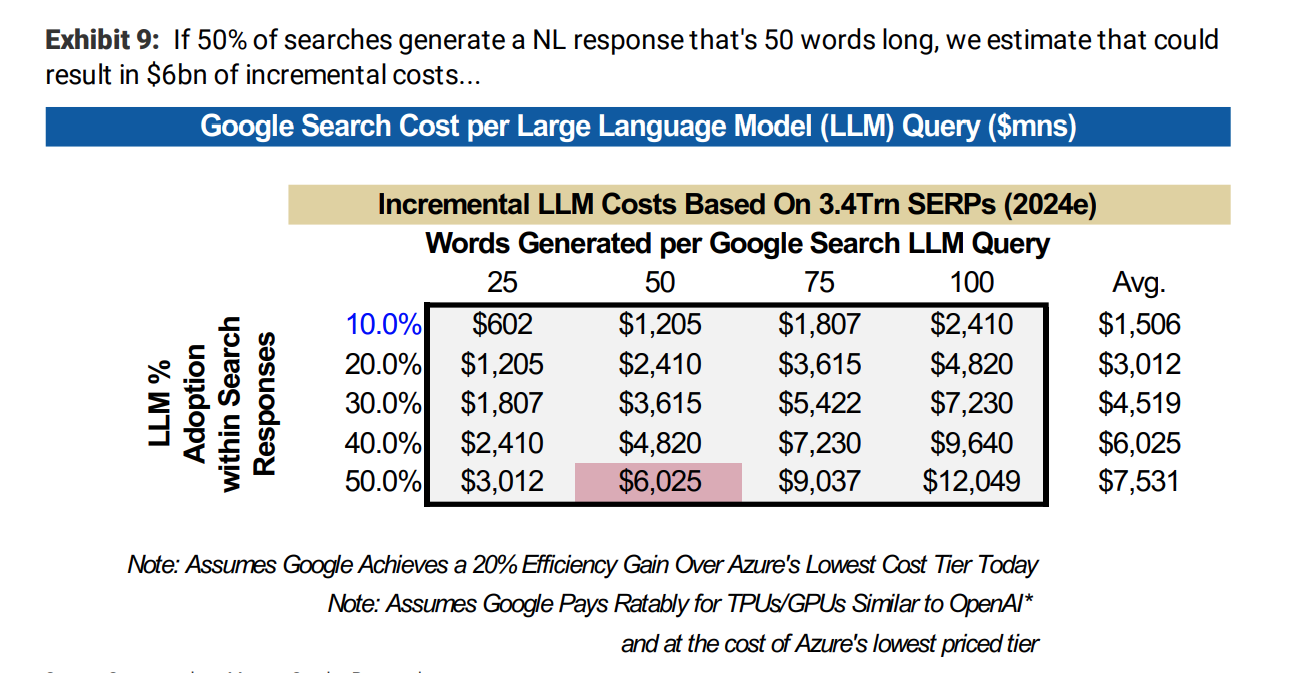
The Cost of AI: How high are incremental AI costs, and what is the impact on GOOGL’s profitability? Based on MSFT, there are about 10B search queries per day globally, and GOOGL captures about 90%, leading to 3.3T annual searches. Factored in model size, time to compute, average word per query, plus the cost of Nvidia A100, and 50% gross margin, these searches may lead to an estimated cost per query of $0.0022 - $0.0220, which is 5x more expensive than a regular query. Morgan Stanley estimated that
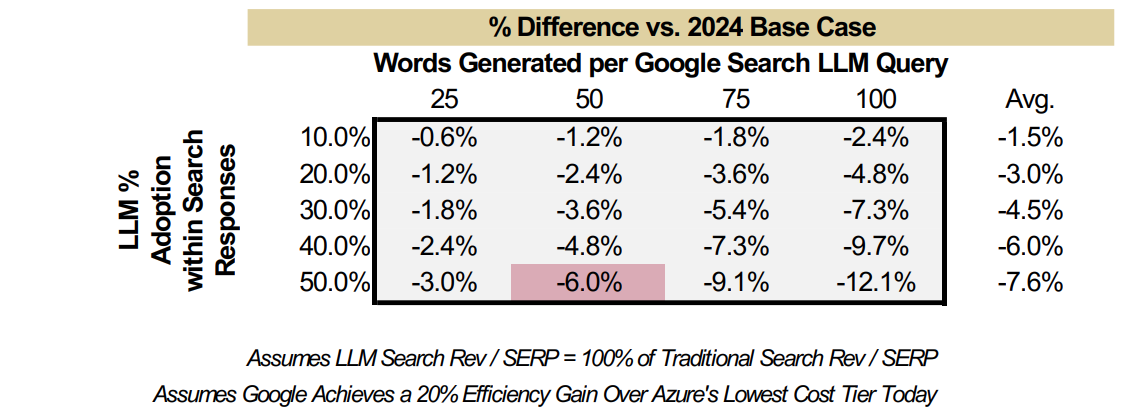
“every 10% of Google search that add AI / NL could add $1.2Bn to FY24 opex… if 50% queries have AI, it would add $6.0bn of incremental loss, all else equal reducing current FY24 EBIT margin by 6%”
Other Implications: While still early, we are curious to watch how intermediary websites (travel, restaurant bookings) would respond. They have powerful local connections but will have to partner with Google or Bing to stay relevant.
Conclusion: Our base case is no immediate threat to Google in the near term, but its share price will remain under pressure. AI-powered search is still very early and is more likely to be incremental than different. With that said, GOOGL is in a tough spot. Every gradual change is a win for MSFT and a loss for Google. Even if Google’s technology is better than OpenAI, it still has to wait for the product to be more widely adopted and proves it can defend its market position. So the risk/ reward is asymmetrical as of now.
Appendix: ChatGPT vs. LaMDA, who is better?
Based on OpenGrowth Hub,” LaMDA and ChatGPT are both based on the GPT-3.5 architecture, but their approaches to training are very different. LaMDA is a supervised-learning model (trained using dialogue data) that generates responses that are more human-natured than those of ChatGPT. ChatGPT is a pre-trained model based on web pages and generates responses from reliable outside sources. As a result, LaMDA is intended to foster a more organic flow of dialogue. ChatGPT has extensive training in web writing, making it well-suited for deciphering complex grammatical structures and responding to queries. So, LaMDA may be more suitable if users are looking for a conversational chatbot, while ChatGPT might be a better option if users are looking for a Q&A platform or research purposes.”
Chart of the Week in the Public Market:

Market correction after Fed’s hawkish comment. Expect more corrections after next week’s CPI print.

Index further moderated from 9.4x to 9.2x - proving that the small jump happened two weeks prior was short-lived. YTD Insurance has rebounded the most but from a relatively low multiple. In comparison Consumer Fintech and Commerce Enablement continue to lead the pack, supporting valuation bounce-back.

Consumer index moderated as well from 3.1x to 2.9x - the last few months we have seen the consumer sector relatively stable at 3x EV/Rev forward multiple. We will see more consumer reporting data come out in the following weeks.

(Market data as of 2/10/2023, source: Bloomberg, CapIQ. See index composition at the bottom)
Chart of the Week in Private Market

(Deal data as of 2/12/2022, source: Pitchbook. Defined as - Series B+ global growth stage deals)
Drop in the near-term trend in deployment pace for primary and announced growth-stage financing. However, it may be worth noting that the slow deployment doesn't necessarily equate to a slow growth market. We have seen multiple structured equity, extension, and secondaries sales happening over the past few months. Those could be hard to capture as those normally don't get announced. The amount of dry powder waiting to get creatively deployed in our industry is still patiently waiting and exploring options.
Sources: Software Index: over 200+ public companies / Fintech Index: V, MA, PYPL, SQ, BILL, ADYEN, SHOP, LSPD / Consumer Index: ABNB, BMBL, CHWY, CVNA, DASH, DHER, DKNG, DUOL, ETSY, FB, FTCH, GDRX, GOOGL, MTCH, NFLX, OPEN, PINS, POSH, PTON, ROKU, SFIX, SNAP, SPOT, UBER, W. Please feel free to ping us for further detailed breakdown