
Compounders 10.30.22

To stay in touch, you can find us here: GZ's Twitter and Shan’s Twitter
Market Commentary: Big Tech Reports - As Predicted, the Picture is Grim
Prior to the quarter, we predicted that we will likely see a wave of earnings guide-down and expectation re-set. With Q3 officially starting last week, the leading large tech companies have shown a similar magnitude of softness across the board. Microsoft, Google, Meta, and Amazon, the corresponding leaders in Cloud Computing, Ads, and e-Commerce, all fell considerably post disappointing earnings results. Now, let’s dive into the takeaways & implications:
1. Cloud Spending Slow Down - Decelerate as Expected, but a lot Faster
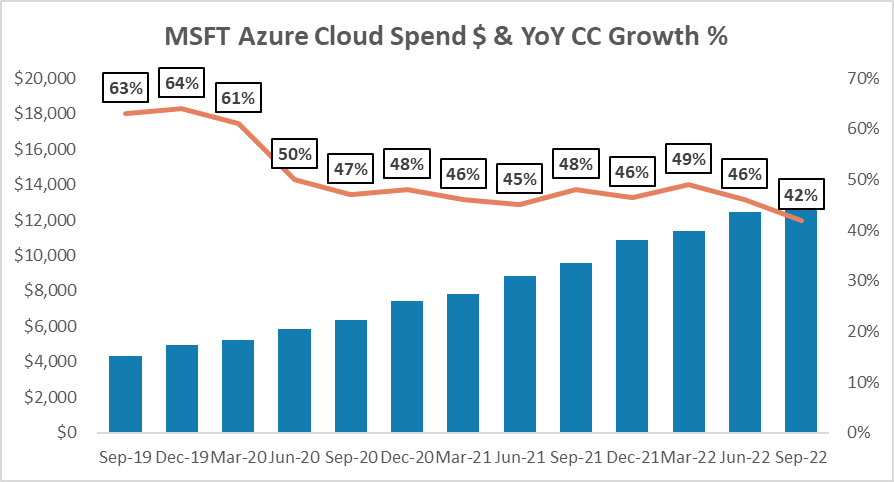
Investors use MSFT as the bellwether for cloud spending. In contrast to the relative strength in the previous two quarters, MSFT’s performance was “soft”.
We think this marks the beginning of the second leg down, aka “earnings revision”. The implication of cloud spending moderation can be profound, as this has been the biggest beta supporting the valuation of SMID cloud names over the past three years.
Based on the rapid pace of deceleration (46% CC prior Q -> 42% -> 37%E.), investors are trimming their growth assumption and looking at mid-20s growth for FY24. In the short term, this will most likely weigh on the growth assumption for SMID names like DDOG, MDB, and a handful of cloud consumption-based businesses. While 1 or 2 quarters of weak performance could be macro-driven and temporary. The bear case is that growth in cloud spending will be more “normalized” as a lot of cloud workload was pulled forward during the pandemic. We will be watching Azure growth and Office 365 closely as they serve as great indicators to track the cloud transition story.
Off to the MSFT earnings:
The two biggest drivers of MSFT price are Azure and O365. We will briefly go over the numbers and dive into the implications:
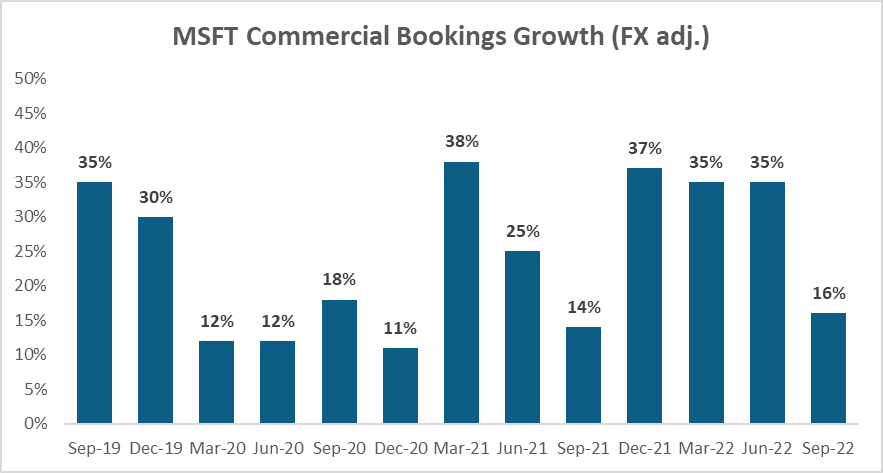
Total revenue was $50.1B, up 11% cc or 6%. Revenue guidance calls for $52.35B - $53.35B, representing 6%-8% growth in CC, far below street estimates. Bookings growth also decelerated meaningfully even considering seasonality
Azure growth came in at 42% cc - slightly below guidance by 1%, driven by workload optimization instead of net new workload reduction. Q2 guidance will further decelerate to 37% cc.
Productivity & Business Processes (PBP) up 15% cc, ahead of consensus. Office 365 grew 17% cc, in line with guidance. Seats were up 14%, driven by SMB and front-line offerings. The seat number was up, but ARPU was down. This is not surprising as growth is driven by SMB and some downgrade from enterprise customers.
Implication and Key Questions:
The slowdown in Azure was expected, but the magnitude of the slowdown spooked the market. Customer number growth was healthy, but customers are tightening their belts and unwilling to spend. Compared to the subscription model, a consumption-based model like cloud computing has no buffer to macro impact. Investors now look at mid-20s growth for FY24. If customers spend less on Azure, the last defending line, they will almost definitely cut spending on less mission-critical areas. We expect competition will be a lot worse as different vendors fight for a pie that is growing less than it used to be. Office 365 growth is driven by SMB this quarter. Seems counterintuitive initially given that SMBs are the most sensitive to macro vulnerabilities. We think this might point to the potential bigger problem - the saturation of the cloud adoption story for MSFT. If this is true, the slowdown in O365 would be structural instead of macro-driven.
Is the downside fully priced in yet? Not quite. We are still dancing between hard landing and soft landing cases and we expect the market / IT spend to be data-dependent going forward. No clarity in sight yet.
2. Ad Revenue is Stagnating, Metaverse in Question, What’s Left?
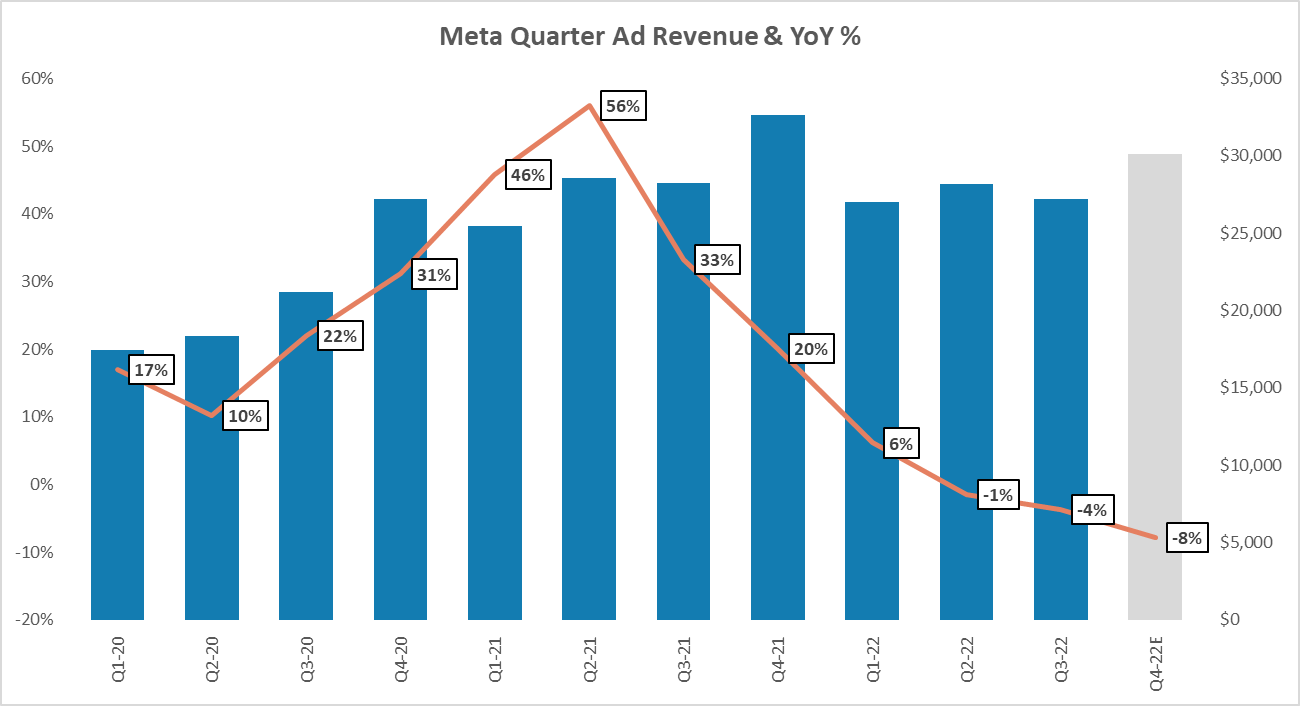
“Ads are NOT cool” - from the early days of trying to stay cool as a social network to slowly but surely incorporating ads into the core platform, Meta has come a long way in the journey of monetization and commercialization of its incredible network of users and engagement. However, it seems that Ads are not turning back to call Meta the “NOT cool” one. This quarter, Ad revenue officially hit a new low at -4% YoY. The almost 100%+ QoQ Reel monetization doesn't seem to be enough to become the backbone of the new Meta’s monetization engine.
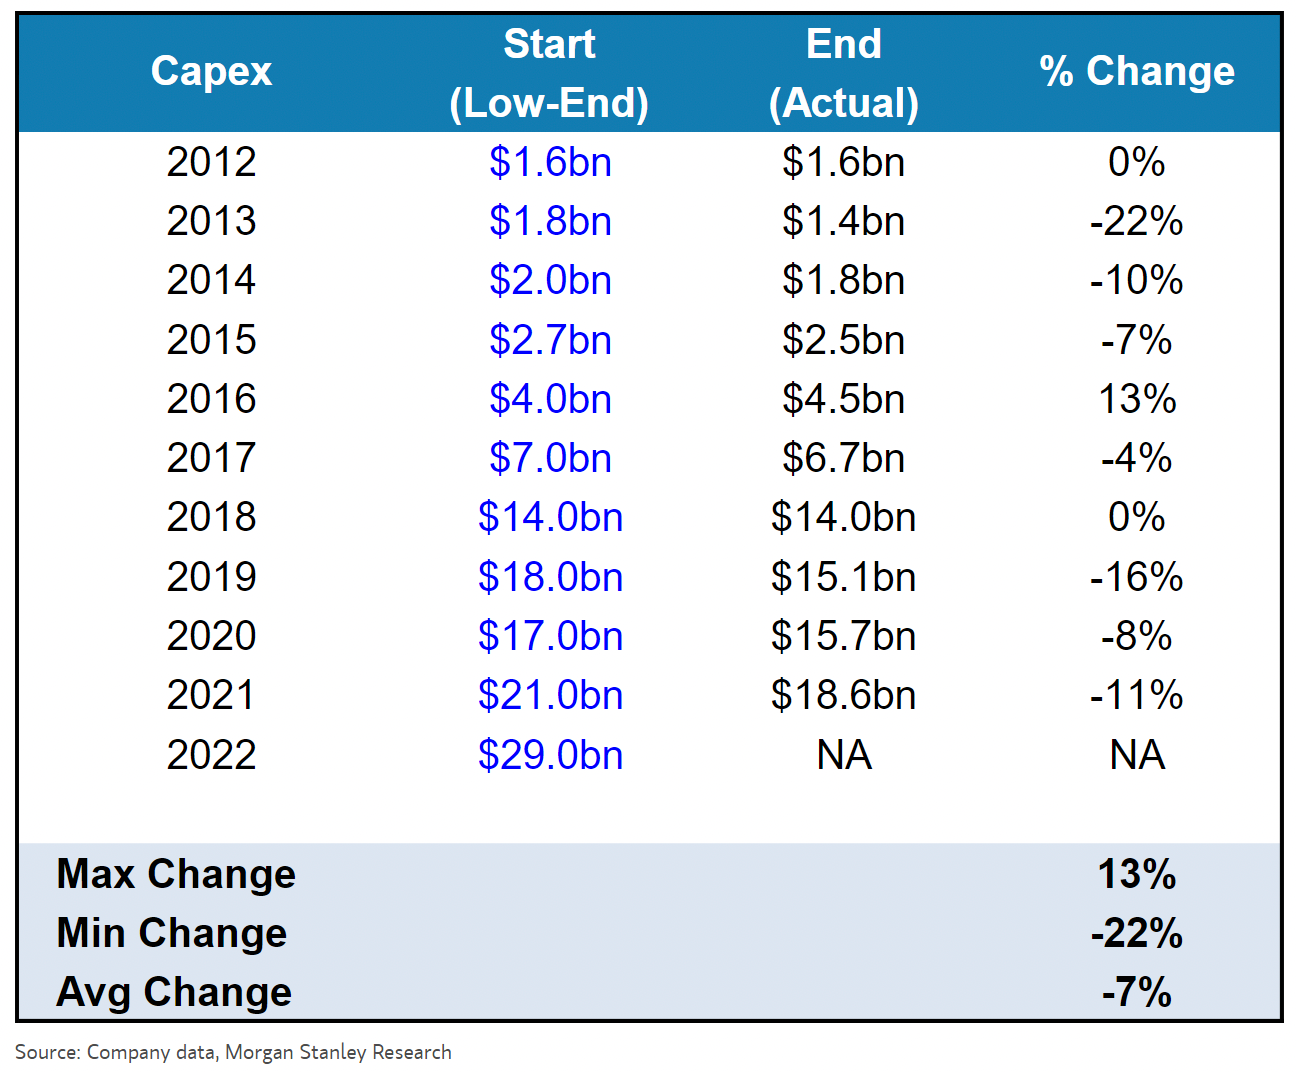
But the sliding Ad Revenue is NOT the only hot debate of this earnings quarter. The cardinal focus on META is about FCF & CapEx + OpEx control. Last week, Brad Gerstner at Altimeter issued an open letter to META - highlighting how it’s time to “Get Fit” with operating leverage and efficiency. To put things into context, the company has aggressively grown the Capex from $7B in 2017 to $14B in 2018 to now close to $30B in 2022E. Morgan Stanley sees the company spend over $69B+ in Metaverse and AI build-out - that’s a lot of $$$$ and honestly not that many companies could afford the investment. We continue to see the need to commit to long-term projects that bring Meta to be the future leader at the intersection of social, commerce, and entertainment - but we are also fully aware that the current environment invites far more scrutiny to mgmt. Execution and operation discipline.
Meta Market Cap got wiped out -26% post-market and the stock sits at over -70%+ YTD - that’s just about $700B of market value. The intensity of the public market this year is not one to ignore.
3. Our current thoughts on short-term price action.
It has been a week of spooky stories for many PMs / investors. We think we are entering the second phase of the tech investment playbook, which is the earnings revisions. Over the next 1-2 weeks, the market might show some upward momentum driven by the mid-term election and peak of rates hike (50bps vs 75bps prior). But if the market front-runs the positive momentum too fast, it will quickly run off-steam.
Chart of the Week in the Public Market

Slight rebound in tech from the previous week.

Light rebound from 9.0x to 9.4x - with all the spotlights around the Large Cap Tech this week, the SMID cap stocks actually saw a nice rebound. Uncertainly this rebound in performance is supported by sustainable flow but certainly a show of relief after weeks of depressed valuation.

Also slight rebound from 2.3x to 2.5x, the Ads subsector’s decline in multiple was somewhat offset by Gaming’s lift up.
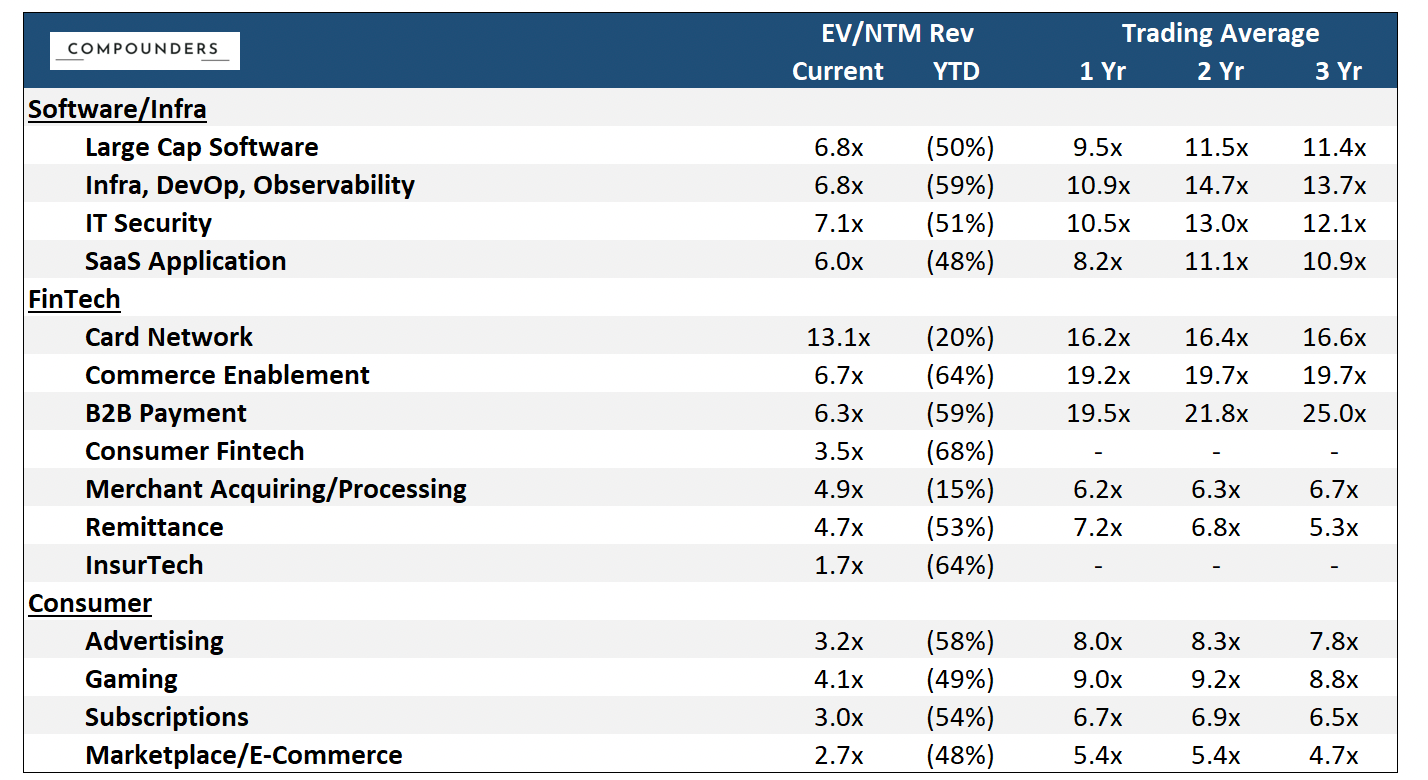
(Market data as of 10/28/2022, source: Bloomberg, CapIQ. See index composition at the bottom)
Chart of the Week in Private Market
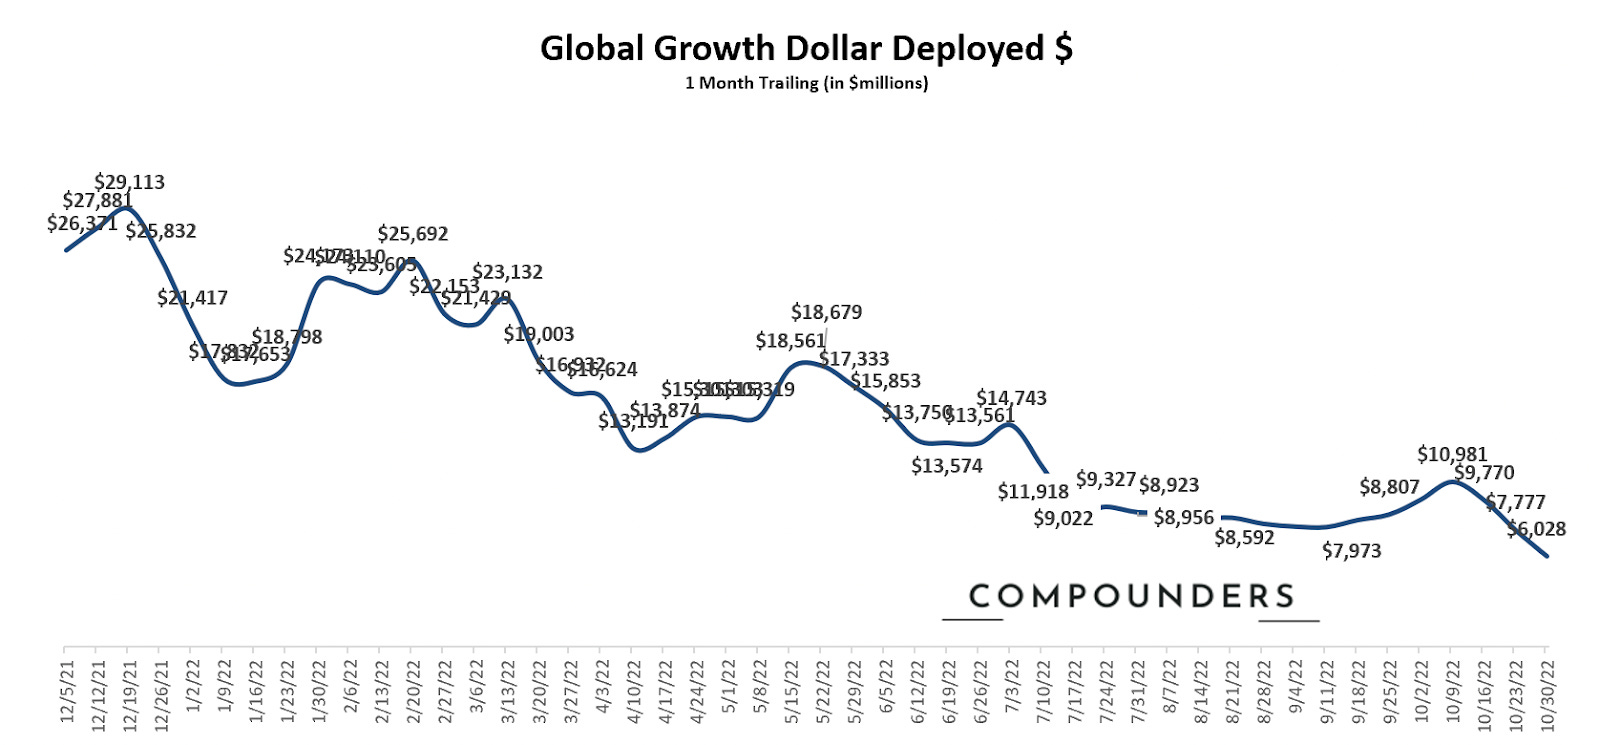
(Deal data as of 10/30/2022, source: Pitchbook. Defined as - Series B+ global growth stage deals)
New Low - now it officially does not seem like the rebound coming out of summer would be long-lived. Capital still predominantly remains on the sideline. This could be a rough winter.
Sources: Software Index: over 200+ public companies / Fintech Index: V, MA, PYPL, SQ, BILL, ADYEN, SHOP, LSPD / Consumer Index: ABNB, BMBL, CHWY, CVNA, DASH, DHER, DKNG, DUOL, ETSY, FB, FTCH, GDRX, GOOGL, MTCH, NFLX, OPEN, PINS, POSH, PTON, ROKU, SFIX, SNAP, SPOT, UBER, W. Please feel free to ping us for further detailed breakdown